
Market Update
Written by: Brett Power, CFA®, CFP®, MBA
November 2019
The stock market has once again hit new all-time highs. This is in no small part driven by last week’s Fed rate cut and other accommodative measures. How should investors react to the rising market, and can the Fed be expected to support markets for the foreseeable future?
As is always the case, it’s important for investors to maintain perspective on this year’s market rally. After all, it was merely a year ago that the market nearly fell into bear market territory amid investor fears of a recession. The fact that the economy has been able to grow at roughly 2% is a prominent reason that markets rebounded. However, it’s also clear that growth has slowed in the U.S. and globally. Despite new record highs for many market indices, it’s likely to be a prudent decision for investors to stay balanced.
This is due to the fact that long-term investors know that market volatility can strike at any time, as we’ve seen over the past few years. Fed rate cuts, now totaling three in a row, can keep markets happy for a time, but not indefinitely. At the moment, the Fed isn’t expected to cut rates again this year, but the nature of the “Fed put” is that investors expect the Fed to come to their rescue when needed. With fewer policy tools available that only work with a lag, and with a variety of economic forces causing uncertainty, it could be increasingly difficult for the Fed to meet the expectations of each investor.
Thus, investors should maintain a keen eye and consider what they wish for in today’s market. Even if Fed stimulus helps in the short run, this usually does not bode well for investors in the long run. This is why long-term investors, who can afford to be both patient and disciplined, should continue to remain balanced across asset classes to navigate global uncertainty.
Below are a number of charts that put the stock market rally, Fed rate cut, and overall economic conditions in perspective. This update is part 1 of 3. Today, we will be focusing on equities, their recent performance, and valuations in a historical context.
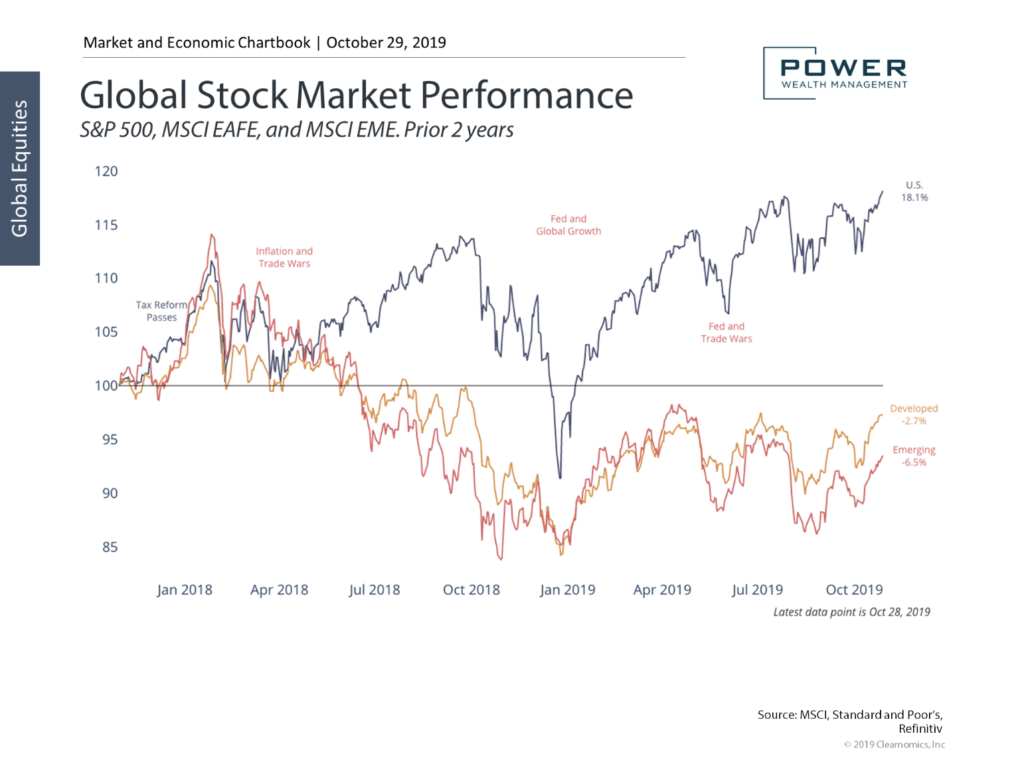
The chart below shows the global stock market performance. Global markets pulled back at the end of last year on the heels of global growth concerns. While volatility around trade wars and slower growth could continue for some time, this should not faze long-term investors. Many of our investors may have noticed our smaller- than- normal allocation in foreign markets over the past year. The allocation toward domestic stock paid off as the U.S. market growth far surpassed developed international. We are watching developments overseas, as well as the currency markets (which can have a significant impact on foreign stock prices) and looking for an opportunity to allocate back into international markets more heavily.
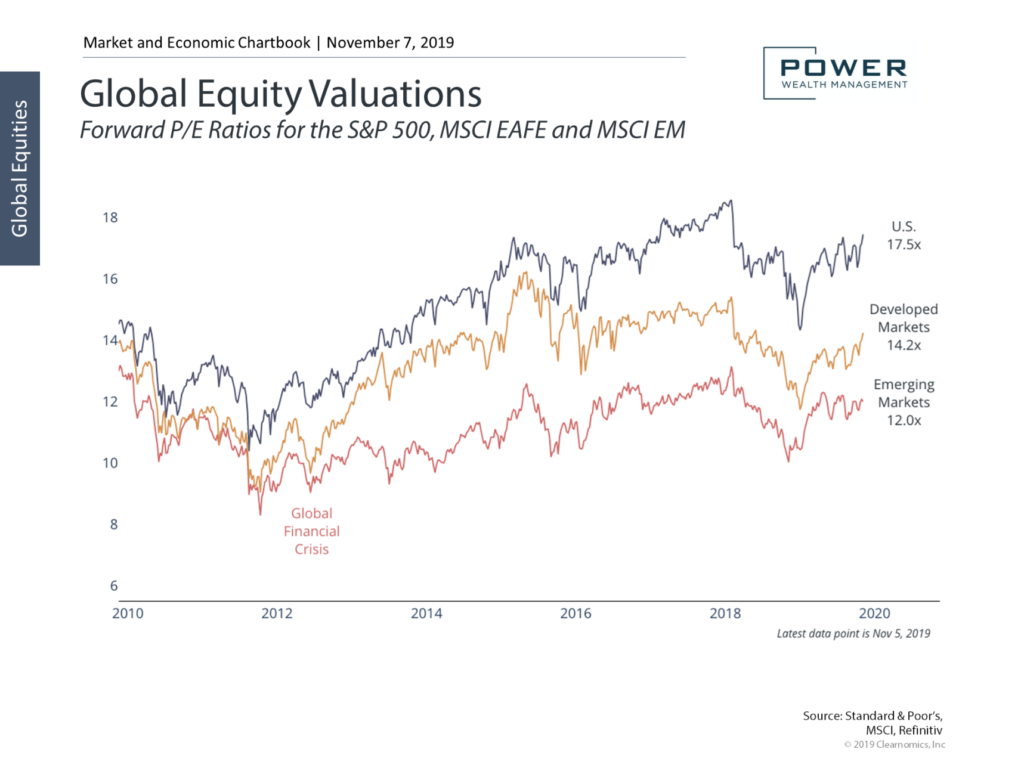
The stock markets of the major regions have taken very different trajectories since 2008. The U.S. market has risen dramatically, leading to stocks that are sitting at above-average valuations. International stocks, on the other hand, are still cheaper in relative terms. Emerging markets, in particular, have just recently begun to rally. While the valuations are more attractive overseas, they face unique challenges and have historically experienced more volatility (specifically in the emerging markets space). When looking for opportunities many investors look for lower valuations. Basically, a lower valuation implies that the stock is “cheaper”. However, this doesn’t necessarily mean that a price increase is around the corner. Since 2012, investments outside the United States have generally had lower valuations, yet their performance has been lackluster. This is probably not a surprise to those who follow the news regarding developments in Europe and Asia. Another factor that cannot be overlooked is the strength of the dollar – especially when considering emerging markets. Most of the debt held by these fast-growing, debt ladened countries is dominated in U.S. Dollars. When the dollar is strong it requires more local currency to fund the debt payments. As we track the opportunities of lower valuations in emerging markets, we are looking for signs that the U.S. dollar could weaken and provide a boost to their economies.
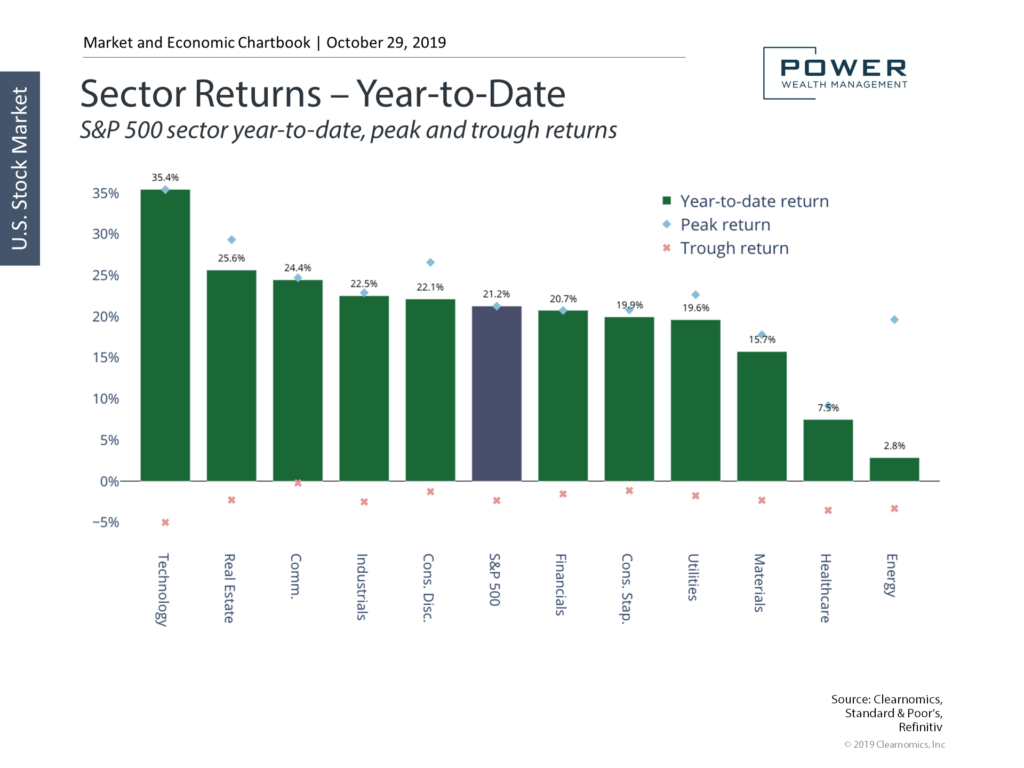
Below, you will find a chart of the S&P 500[i] sector returns. Sector returns have varied significantly as a result of global market volatility. Some cyclical sectors have pulled back as investors worry about global growth, trade and the Fed. Technology has remained resilient and posted an incredible 35% return year to date (thank you all for buying iPhones). One of the key factors in effective portfolio management is proactive rebalancing (keeping your allocation in place as prices move over time)[ii]. It has become critically important to not only rebalance across size and style (large companies and small companies – Value and Growth) but also across sectors.
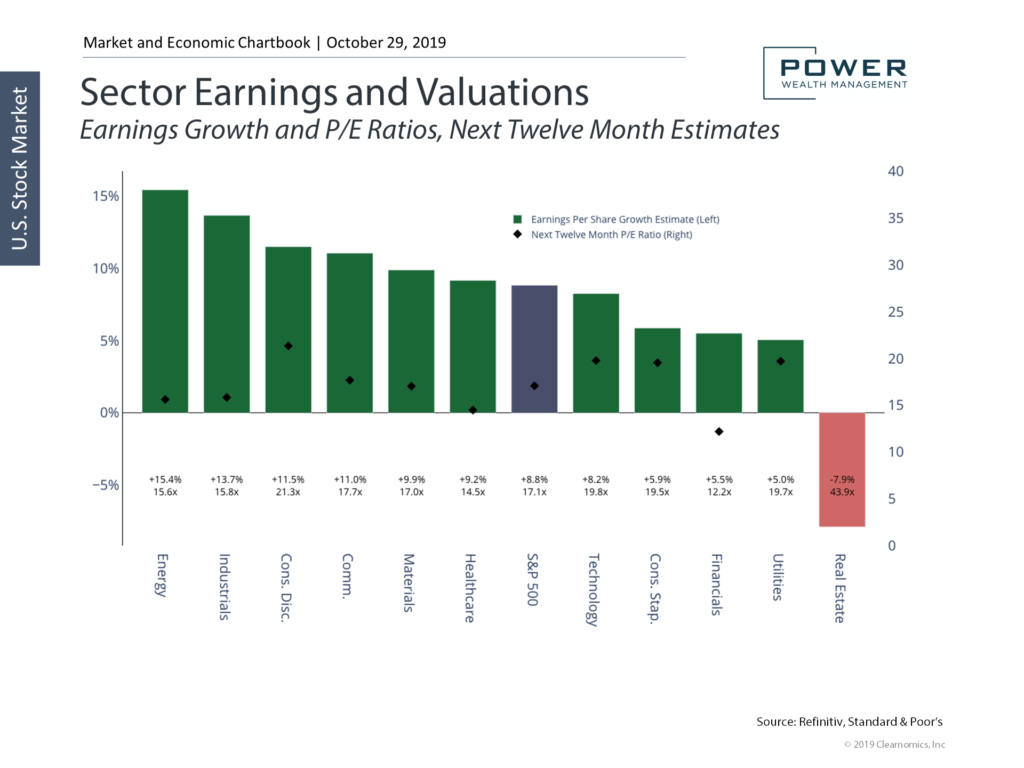
While the overall market is no longer cheap, there are opportunities within individual sectors. Strong earnings growth has benefited most sectors. Many are still expected to see double-digit gains. Only Real Estate earnings are negative due to rising rates and a slowdown in building activity. What is interesting to note is the comparison between the chart above vs. the chart below. The above chart shows year-to-date returns while the below chart shows valuations. Many investors tend to chase returns. In this case, the worst-performing asset class year-to-date (energy) is now one of the least “expensive” investments for each dollar of earnings it provides. Every asset class fluctuates in price and valuation. It is a common practice for investors to add to those investments “doing well” and sell those “doing poorly”. Over time, however, it often is advantageous to do the opposite and benefit from the cyclical nature of sectors. It is also important to note that valuations are based on projections of growth over the next year. Technology has a lower valuation than consumer discretionary even after a 35% increase in price. There are incredibly high growth expectations for technology to meet, and any slowdown could bring stock prices significantly lower. An extreme example of this scenario in play was the Dot.com bubble in 2000. The market was flourishing in the unrelenting pace of growth for technology. When it was realized that these expectations were too lofty, the NASDAQ fell over 78% from high to low. During that same time, many other stocks did quite well and could have insulated an investor from devastating losses. It is key to remember to remain diversified through any market[iii].
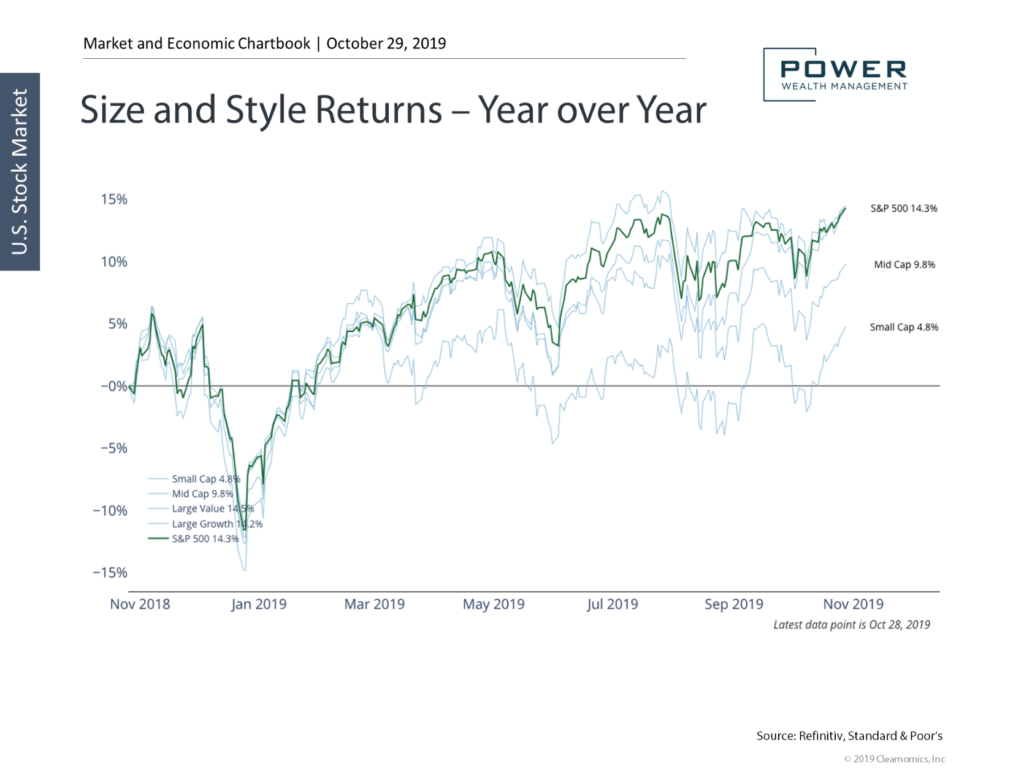
The chart below breaks the market return down by company size. While the overall stock market has been strong, there has been a dispersion between sizes and styles. Large-cap stocks have done well this cycle, and large-cap growth has also thrived. Recent volatility has reduced some of those gains. However, staying diversified across sizes and styles is still critical to the best interest of the investor. Historically, small and midcap stocks have performed better over time when compared to large-cap companies. The recent disparity of returns between small, mid, and large-cap have caused some concern that the recent rally could be challenged.
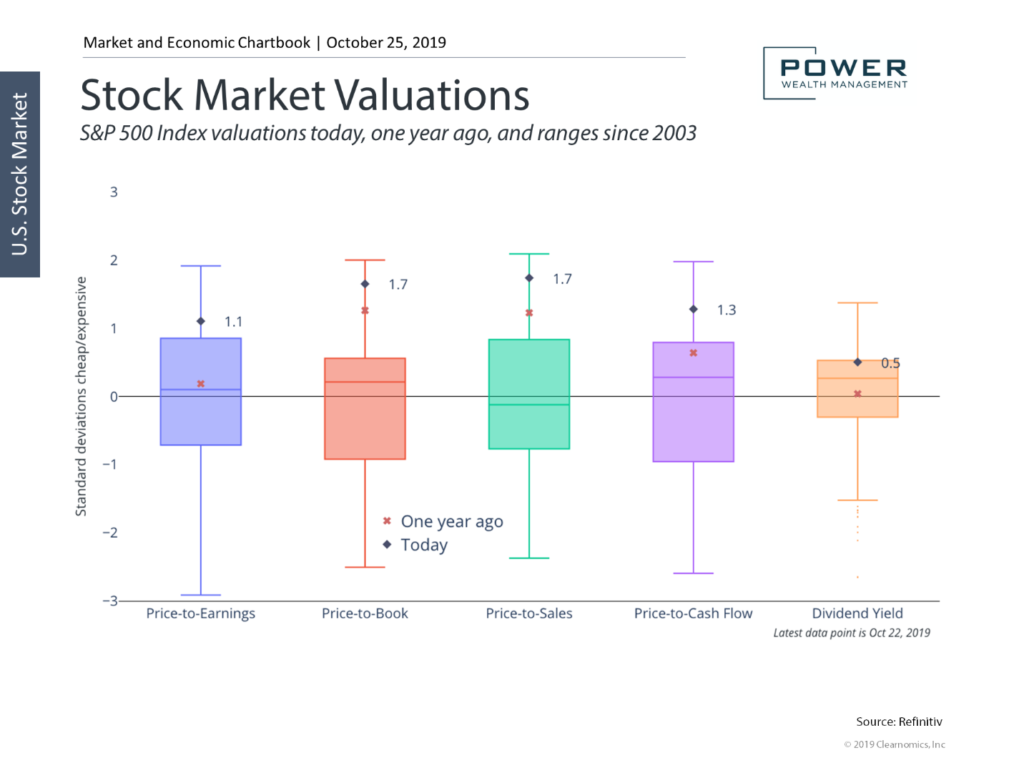
Most parts of the market have positive earnings outlooks across size and style categories. Valuations, however, differ significantly, especially because growth has outperformed value. While growth stocks can continue to outperform, value stocks tend to have a premium over the long run. Nearly all valuations suggest that the market isn’t cheap, but also not astronomically expensive. Valuations have been lower in prior years, and certainly when compared to the 1990s. Generally, we would like to see valuations remain constant as prices rise – with the price reflecting stronger company metrics(if a company generates more revenue and the stock appreciates at a similar rate, valuations stay constant as prices rise – alternatively, if a stock price increases with the same or worsening fundamentals, valuations fall). The chart above provides some context to valuations in the light of where they have been historically, where they are now, and where they were one year ago.
As we head into year-end, we remain cautiously optimistic about the condition of the economy and markets. Current instability with global trade, high valuations, and low year-to-year corporate revenue growth provides fuel to our caution. Depending on your suitability, we remain allocated to equities but shifted toward more defensive sectors. We believe the economy as a whole is strong and will continue to expand, albeit at a reduced rate, into 2020. Be on the lookout for part 2 and 3 of this update! We will be discussing the fixed income markets and the presidential election cycle’s potential effect on stocks[v].
[i] S&P 500 Index is an unmanaged group of securities considered to be representative of the stock market in general. You cannot directly invest in the index.
[ii] Rebalancing assets can have tax consequences. If you sell assets in a taxable account you may have to pay tax on any gain resulting from the sale. Please consult your tax advisor.
[iii] Using diversification as part of your investment strategy neither assures nor guarantees better performance and cannot protect against loss of principal due to changing market conditions.
[v] The opinions expressed in this commentary are those of the author and may not necessarily reflect those held by Kestra IS or Kestra AS. The material is for informational purposes only. It represents an assessment of the market environment at a specific point in time and is not intended to be a forecast of future events or a guarantee of future results. It is not guaranteed by Kestra IS or Kestra AS for accuracy, does not purport to be complete and is not intended to be used as a primary basis for investment decisions. It should also not be construed as advice meeting the particular investment needs of any investor. Neither the information presented, nor any opinion expressed constitutes a solicitation for the purchase or sale of any security.